

RadOnc News
The Focal Spot: Ehsan Samei
In this edition of The Focal Spot, I interview Ehsan Samei, PhD. Ehsan is a Professor of Medical Physics at Duke University.
V2.5's New Features Now Empower Patient-Specific QA (without the phantom)
Introduction
Exciting news: the latest release of ClearCalc and RadMonteCarlo (v2.5) is here, packed with powerful new features designed to streamline your workflow and elevate patient care.
One of the most significant additions is the integration of log file analysis capabilities with RadMonteCarlo. This groundbreaking feature adds to the secondary calculation platform, allowing you to delve deeper into evaluating delivered versus prescribed plan quality. With ClearCalc, these updates combine gold-standard accuracy with phantomless patient-specific quality assurance (PSQA).
Let’s briefly explore what’s new in version 2.5, dig into log file analysis , and consider how log files coupled with RadMonteCarlo may complement or change the way you perform IMRT and VMAT QA.
What’s New in V2.5
With any new version release, the Radformation approach is consistent: balance adding brand-new features with improved functionality of the existing platform. Here’s what’s new in our recent release:
Updates to ClearCalc/RadMC v2.5
Log File Analysis is Here
While there are many updates worth celebrating, let’s explore one of these product updates in more detail: log file analysis.
Log files contain snapshots of machine performance details during plan delivery and provide positional readouts of individual MLC leaves as they move throughout the treatment. Analyzing this array of data as-delivered can identify potential deviations from planned positions to allow an impact assessment of these deviations on the accuracy of patient plan delivery.
Log files can be used to monitor leaf position accuracy for ongoing quality assurance purposes and can also be used as a method of patient-specific QA. Along with powerful secondary calculations, log file analysis—now available for both ClearCalc and RadMonteCarlo—provides a comprehensive assessment of delivered plan quality relative to the prescribed plan for both Varian and Elekta linacs.
ClearCalc Finite-Size Pencil Beam Analysis
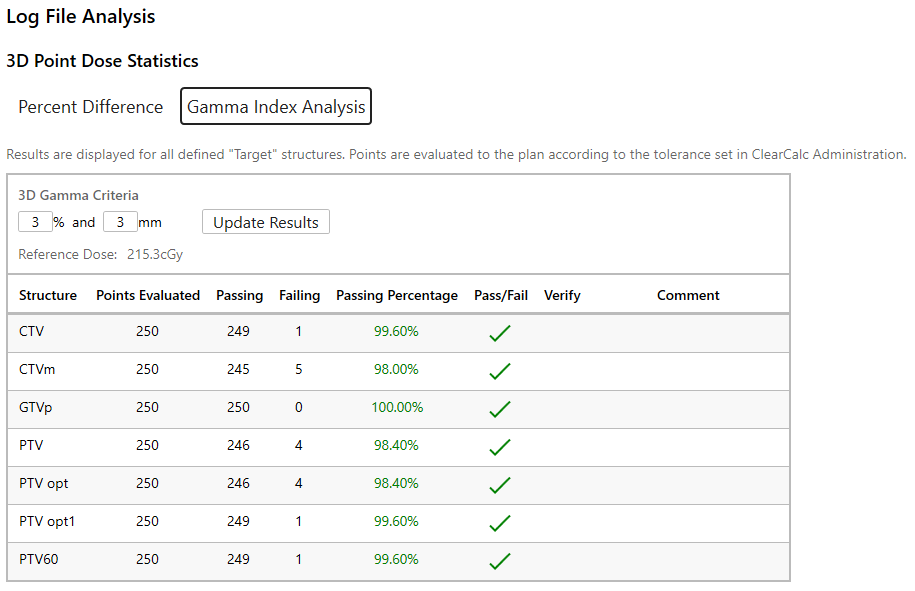
In the Log File Analysis module, the 3D point dose statistics display looks similar to the main secondary calculation results interface. The difference is that with log files, all points (a maximum of 250 per structure) are analyzed based on the dose calculated from log file machine parameters. ClearCalc compiles all target structures (e.g., GTV, CTV, PTV, ITV) within the treatment plan for volumetric statistical analysis using either a percent difference or gamma index analysis.
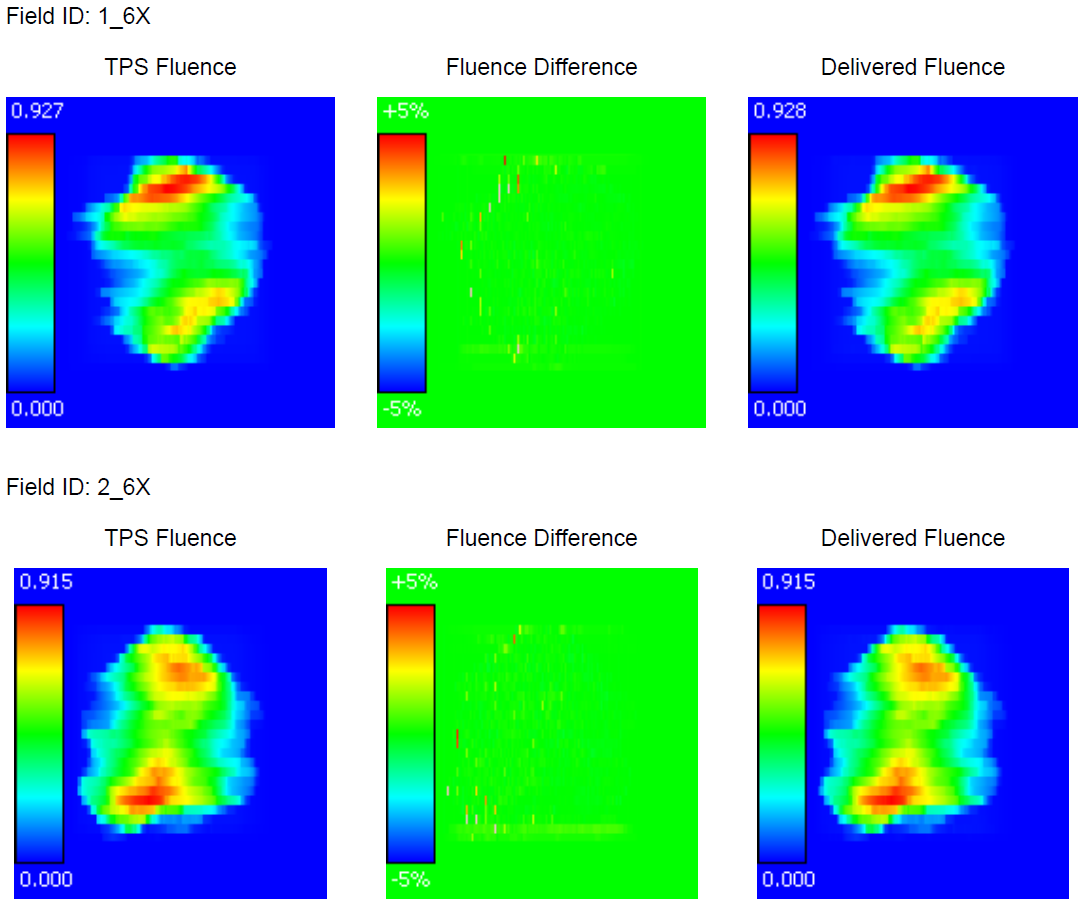
To get a feel for planar dose agreement, ClearCalc also provides a fluence comparison section that utilizes the 3D dose from the treatment plan to create a 2D planar fluence for each individual field at the maximum dose plane. A similar fluence plane is generated at the same location using ClearCalc's finite-sized pencil beam algorithm calculated using the delivered log file machine parameters. These two planes are compared using relative intensity and a Fluence Difference image is displayed.

Results are analyzed and displayed in two different ways, using the Percent Difference or Gamma Index Analysis, to provide options for clinical users.
 RadMonteCarlo 3D Analysis
With the addition of the RadMonteCarlo option within the log file analysis workspace, users have access to an advanced toolset for full volumetric analysis for machine-delivered plans, with complete integration with ClearCalc. RadMonteCarlo leverages the power and speed of cloud-based service-oriented architecture to perform a full Monte Carlo particle simulation on the delivered log file treatment parameters. Once complete, the calculated dose matrix is returned to the local workstation.
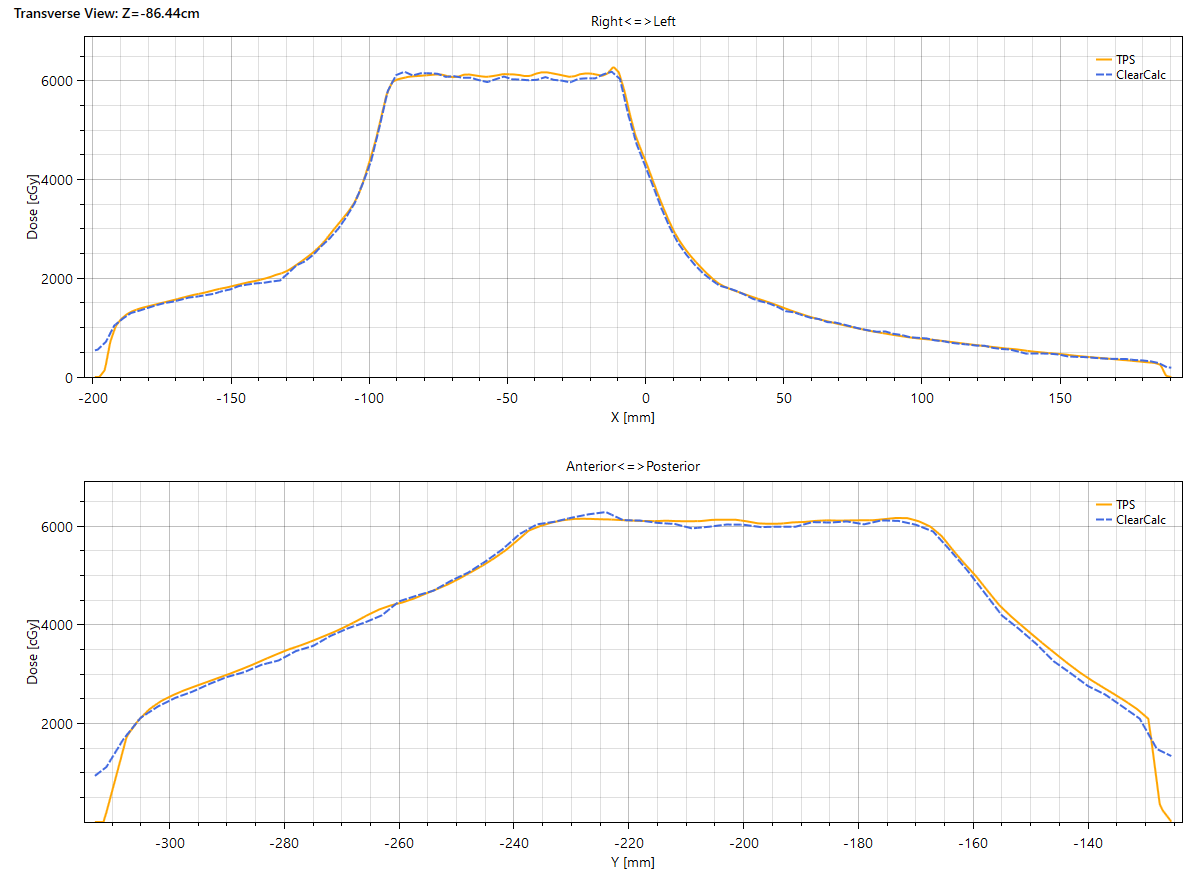
With gold-standard calculations applied to the entire dataset, a full 3D gamma analysis for target structures, organs at risk, and the full dose matrix is available. The resolution of the calculation lends itself to more granular and detailed analysis. Dose profile comparison offers a detailed view of cross-sectional doses, allowing the assessment of local percent differences between the TPS and the delivered dose.
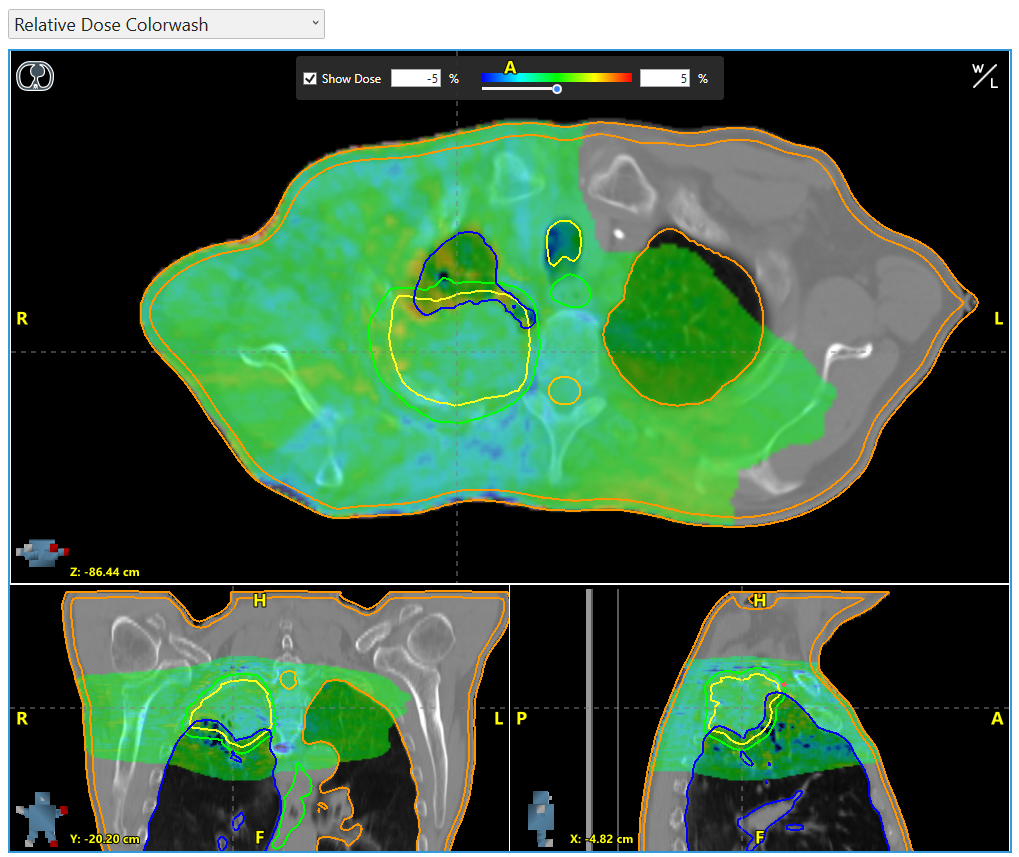
The platform provides an array of visualization choices, including the ability to analyze various color wash overlays on the patient CT with the following options:
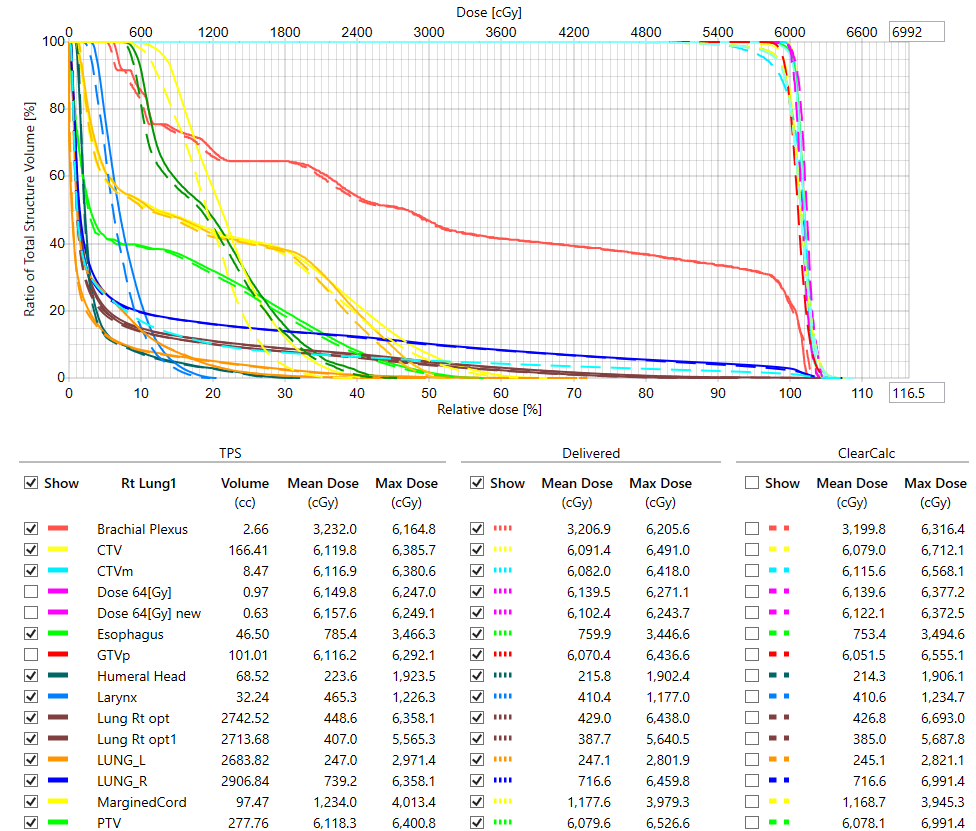
DVH curves are also available for TPS structures, RadMonteCarlo planned dose (optional), and RadMonteCarlo delivered dose.
Log Files For IMRT QA?
We’re not here to start a debate or end one. However, there is a long-standing debate within the medical physics community: are log files an appropriate tool for PSQA? How do they relate with phantom-based methods? Do they compete with them in any way, are they poised to replace them, or are they a complement to the status quo?
This has been the topic of multiple point-counterpoint entries in Medical Physics Journal and JACMP (in 2011, 2013, and 2015), with debaters providing thought-provoking discussion points on both sides.
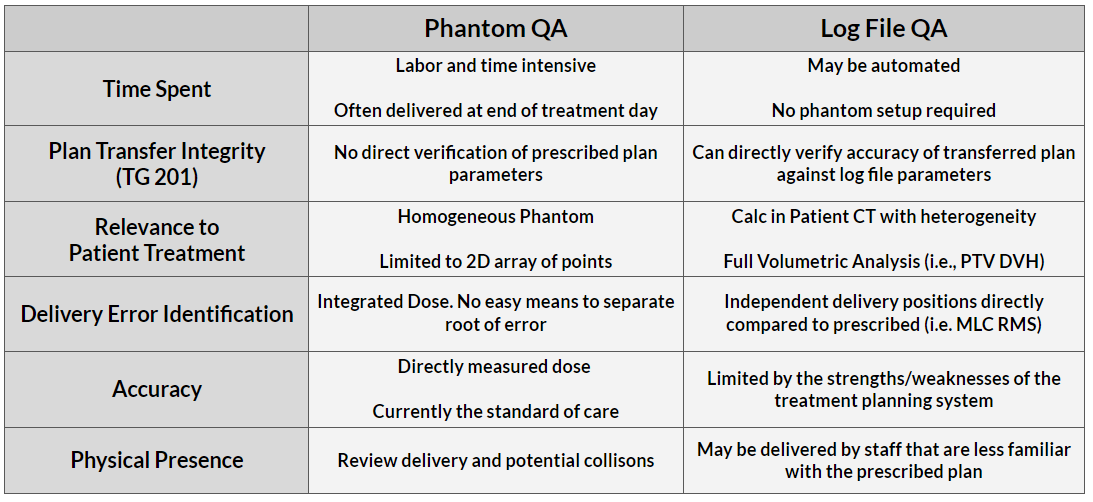
We see merit on both sides of the debate and see value in both. So, whether clinicians are looking to replace traditional phantom-based QA with log file-based QA or use it to complement their phantom-based PSQA program, we’re here for it. RadMonteCarlo offers the calculation precision you need to take your QA program to the next level.
Conclusion
The introduction of RadMonteCarlo to the log file analysis module (and improvements to the ClearCalc analog) represents a significant leap forward for secondary calculations, opening the door for IMRT and VMAT QA. This powerful tool empowers medical physicists with a deeper understanding of machine performance during treatment delivery, enabling a more nuanced approach to ensuring patient safety and treatment efficacy.
But this is just the beginning. Here at Radformation, we're constantly innovating to push the boundaries of PSQA. Here’s what we have in mind for the future:
These advancements, coupled with the existing strengths of log file analysis in RadMonteCarlo and ClearCalc, promise a future where PSQA becomes more efficient, informative, and ultimately, more effective in ensuring the best possible outcomes for every patient.
Want to see ClearCalc and RadMonteCarlo in Action?
Check out the latest webinar on log file analysis and other v2.5 updates
—or—
Schedule a demo to learn more about how ClearCalc and RadMonteCarlo can fit into your department.

Leave a comment